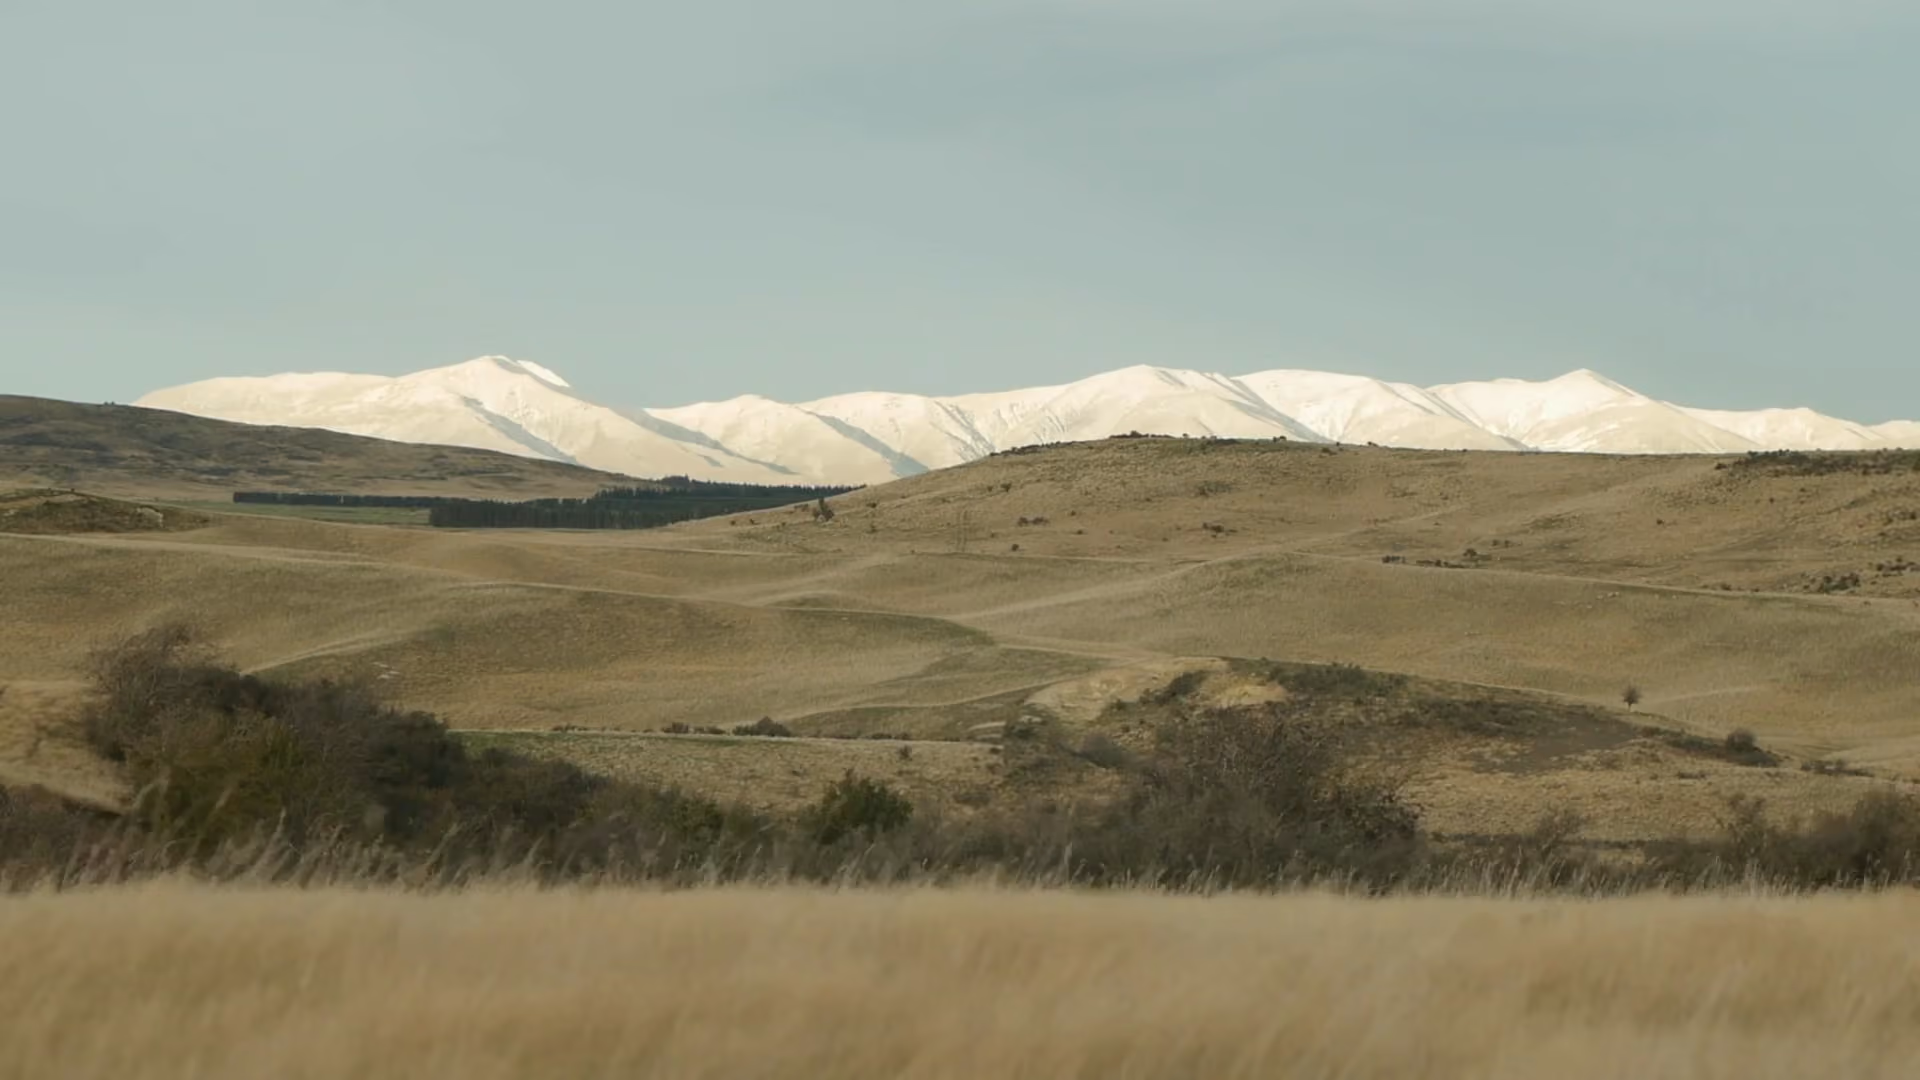
Rolling brown hills with sparse bushes and trees in the foreground, and a range of snow-capped mountains under a clear sky in the background.
Platform

Imagery to action, across every mile

Problem

More data hasn’t made decisions any easier

Utilities have access to more imagery, data, and information than ever. Most of it remains disconnected and difficult to use.
Remote sensing
Encroachment
Moisture
Strike tree
Fuel Risk
Historic outages
Cost per span
Customers
Reclosers
Utility
01
Capture
02
Process
03
Analyze
04
Operationalize
Our Platform

Every signal.
One plan.

Overstory brings together high-resolution imagery, proprietary models, and operational context to create one dynamic view of your network and the physical world around it.

The right image, at the right moment

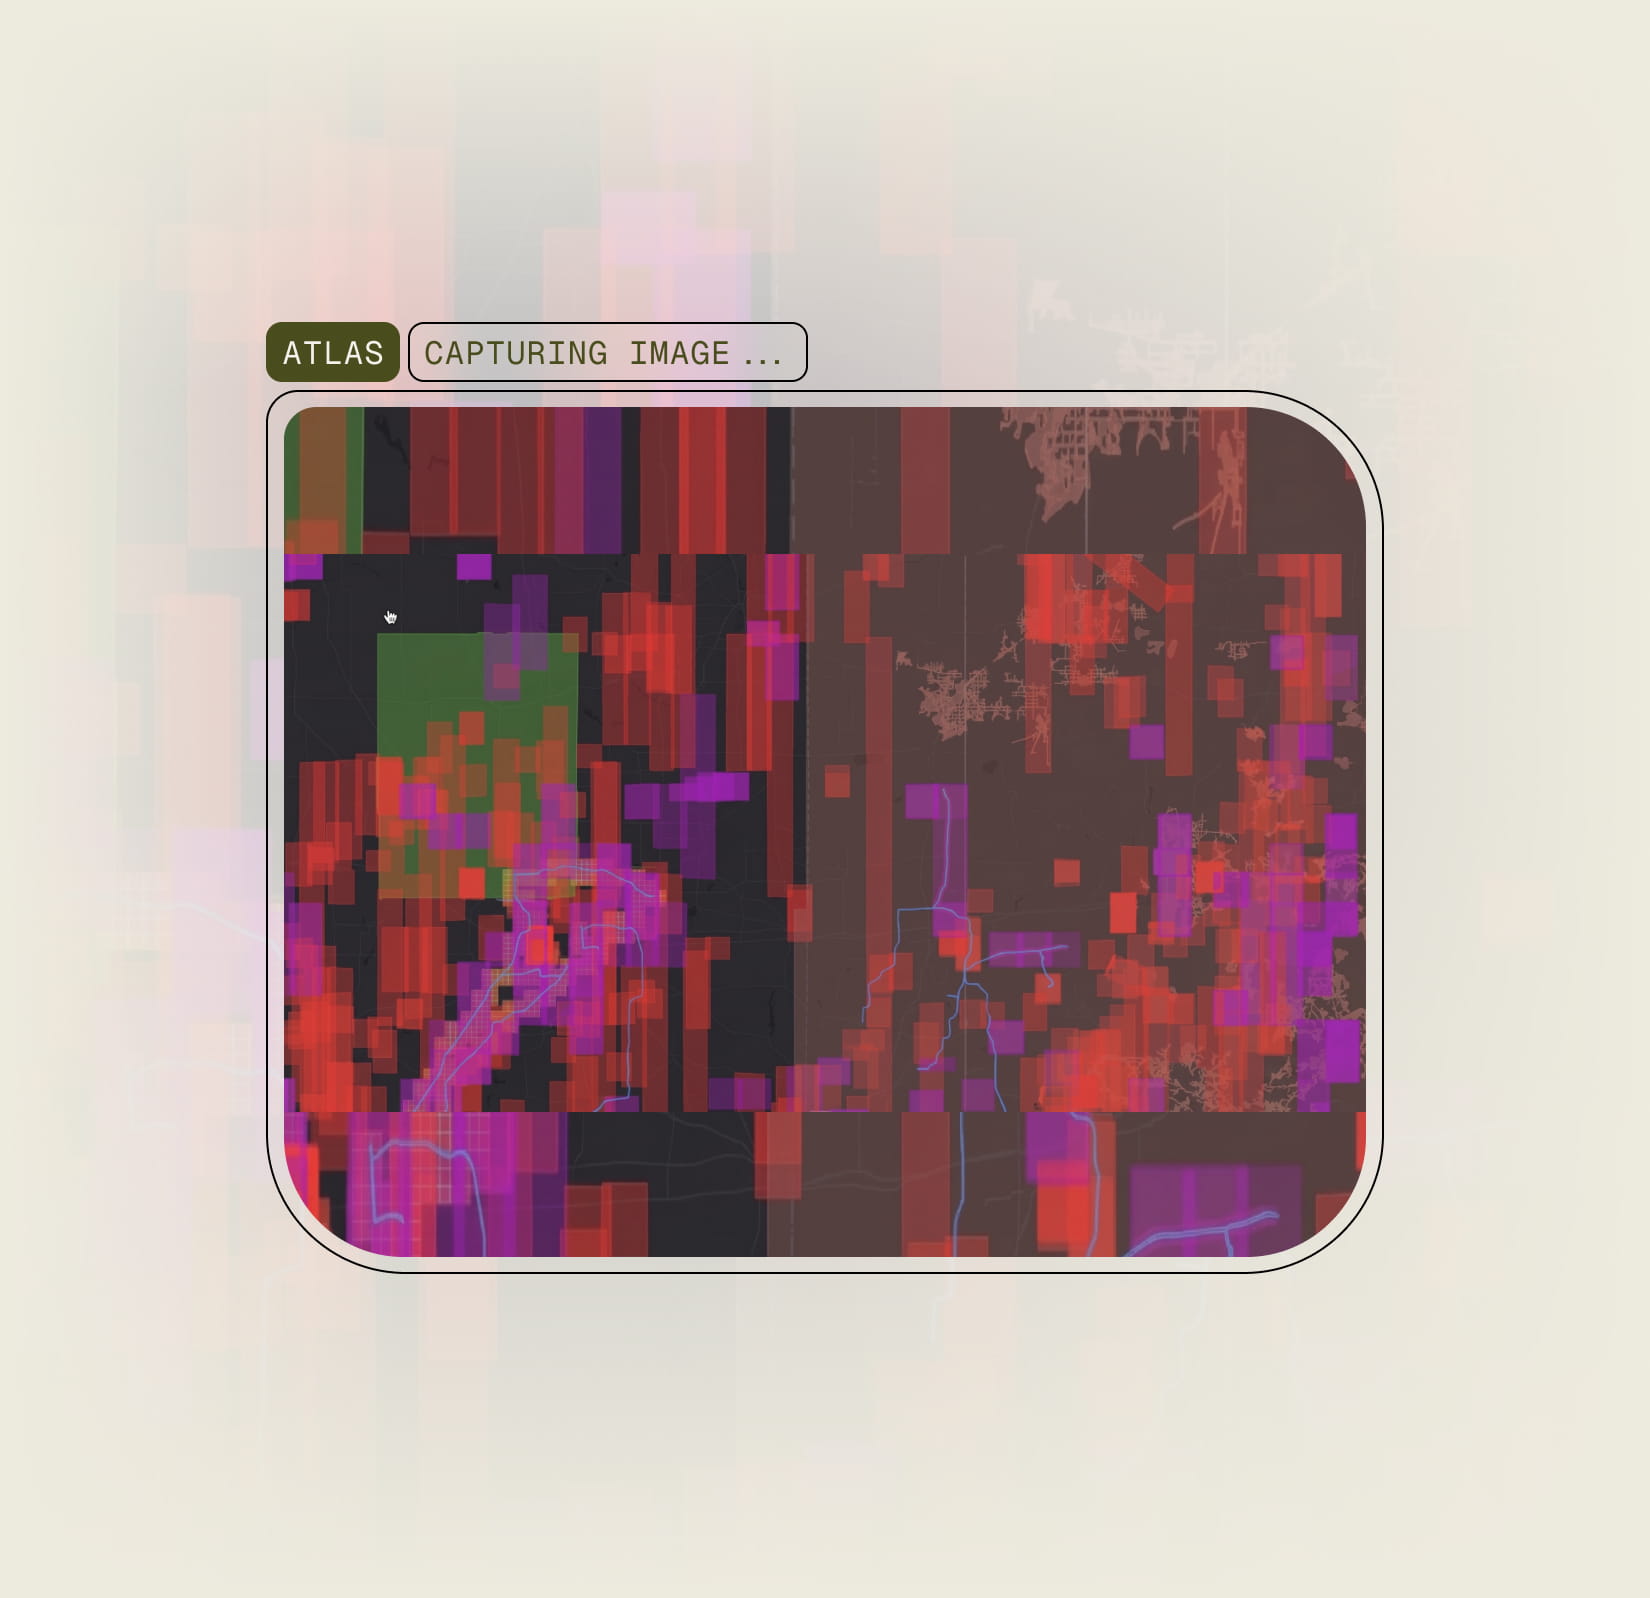
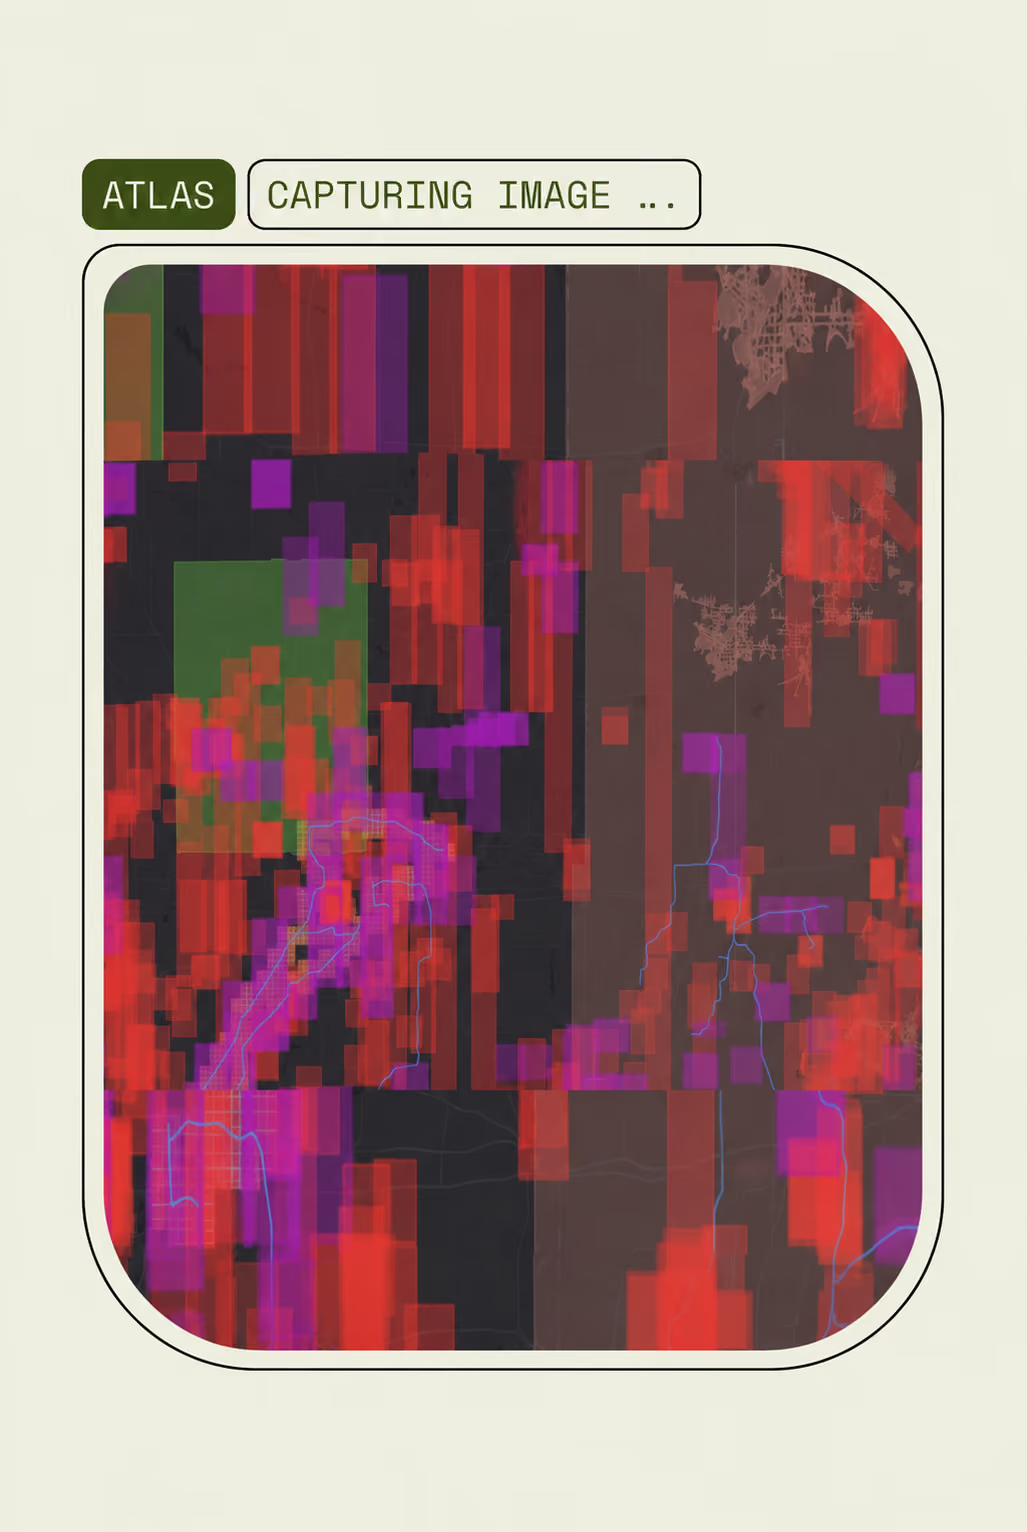
Our proprietary acquisition tool, Atlas, coordinates providers, monitors capture windows, and verifies line coverage to build a reliable year over year view of the network.

Raw imagery is only the beginning

Overstory transforms imagery into an accurate representation of the network and the environment around it.

Models built for the questions utilities face.

Each Overstory model turns a physical condition into a measurable layer of intelligence. Together, they provide a more complete view of where risk exists and how it is changing.

Built for how your utility operates.

Intelligence only creates value when it leads to action. Our experts work alongside your teams to understand the outcomes you need, the decisions you make, and the systems you use.


Integrates with
A digital map interface labeled 'ATLAS CAPTURING IMAGE...' showing pixelated blocks in red, purple, and green over a dark background with faint lines resembling roads or boundaries.Atlas capturing satellite imagery of a utility network
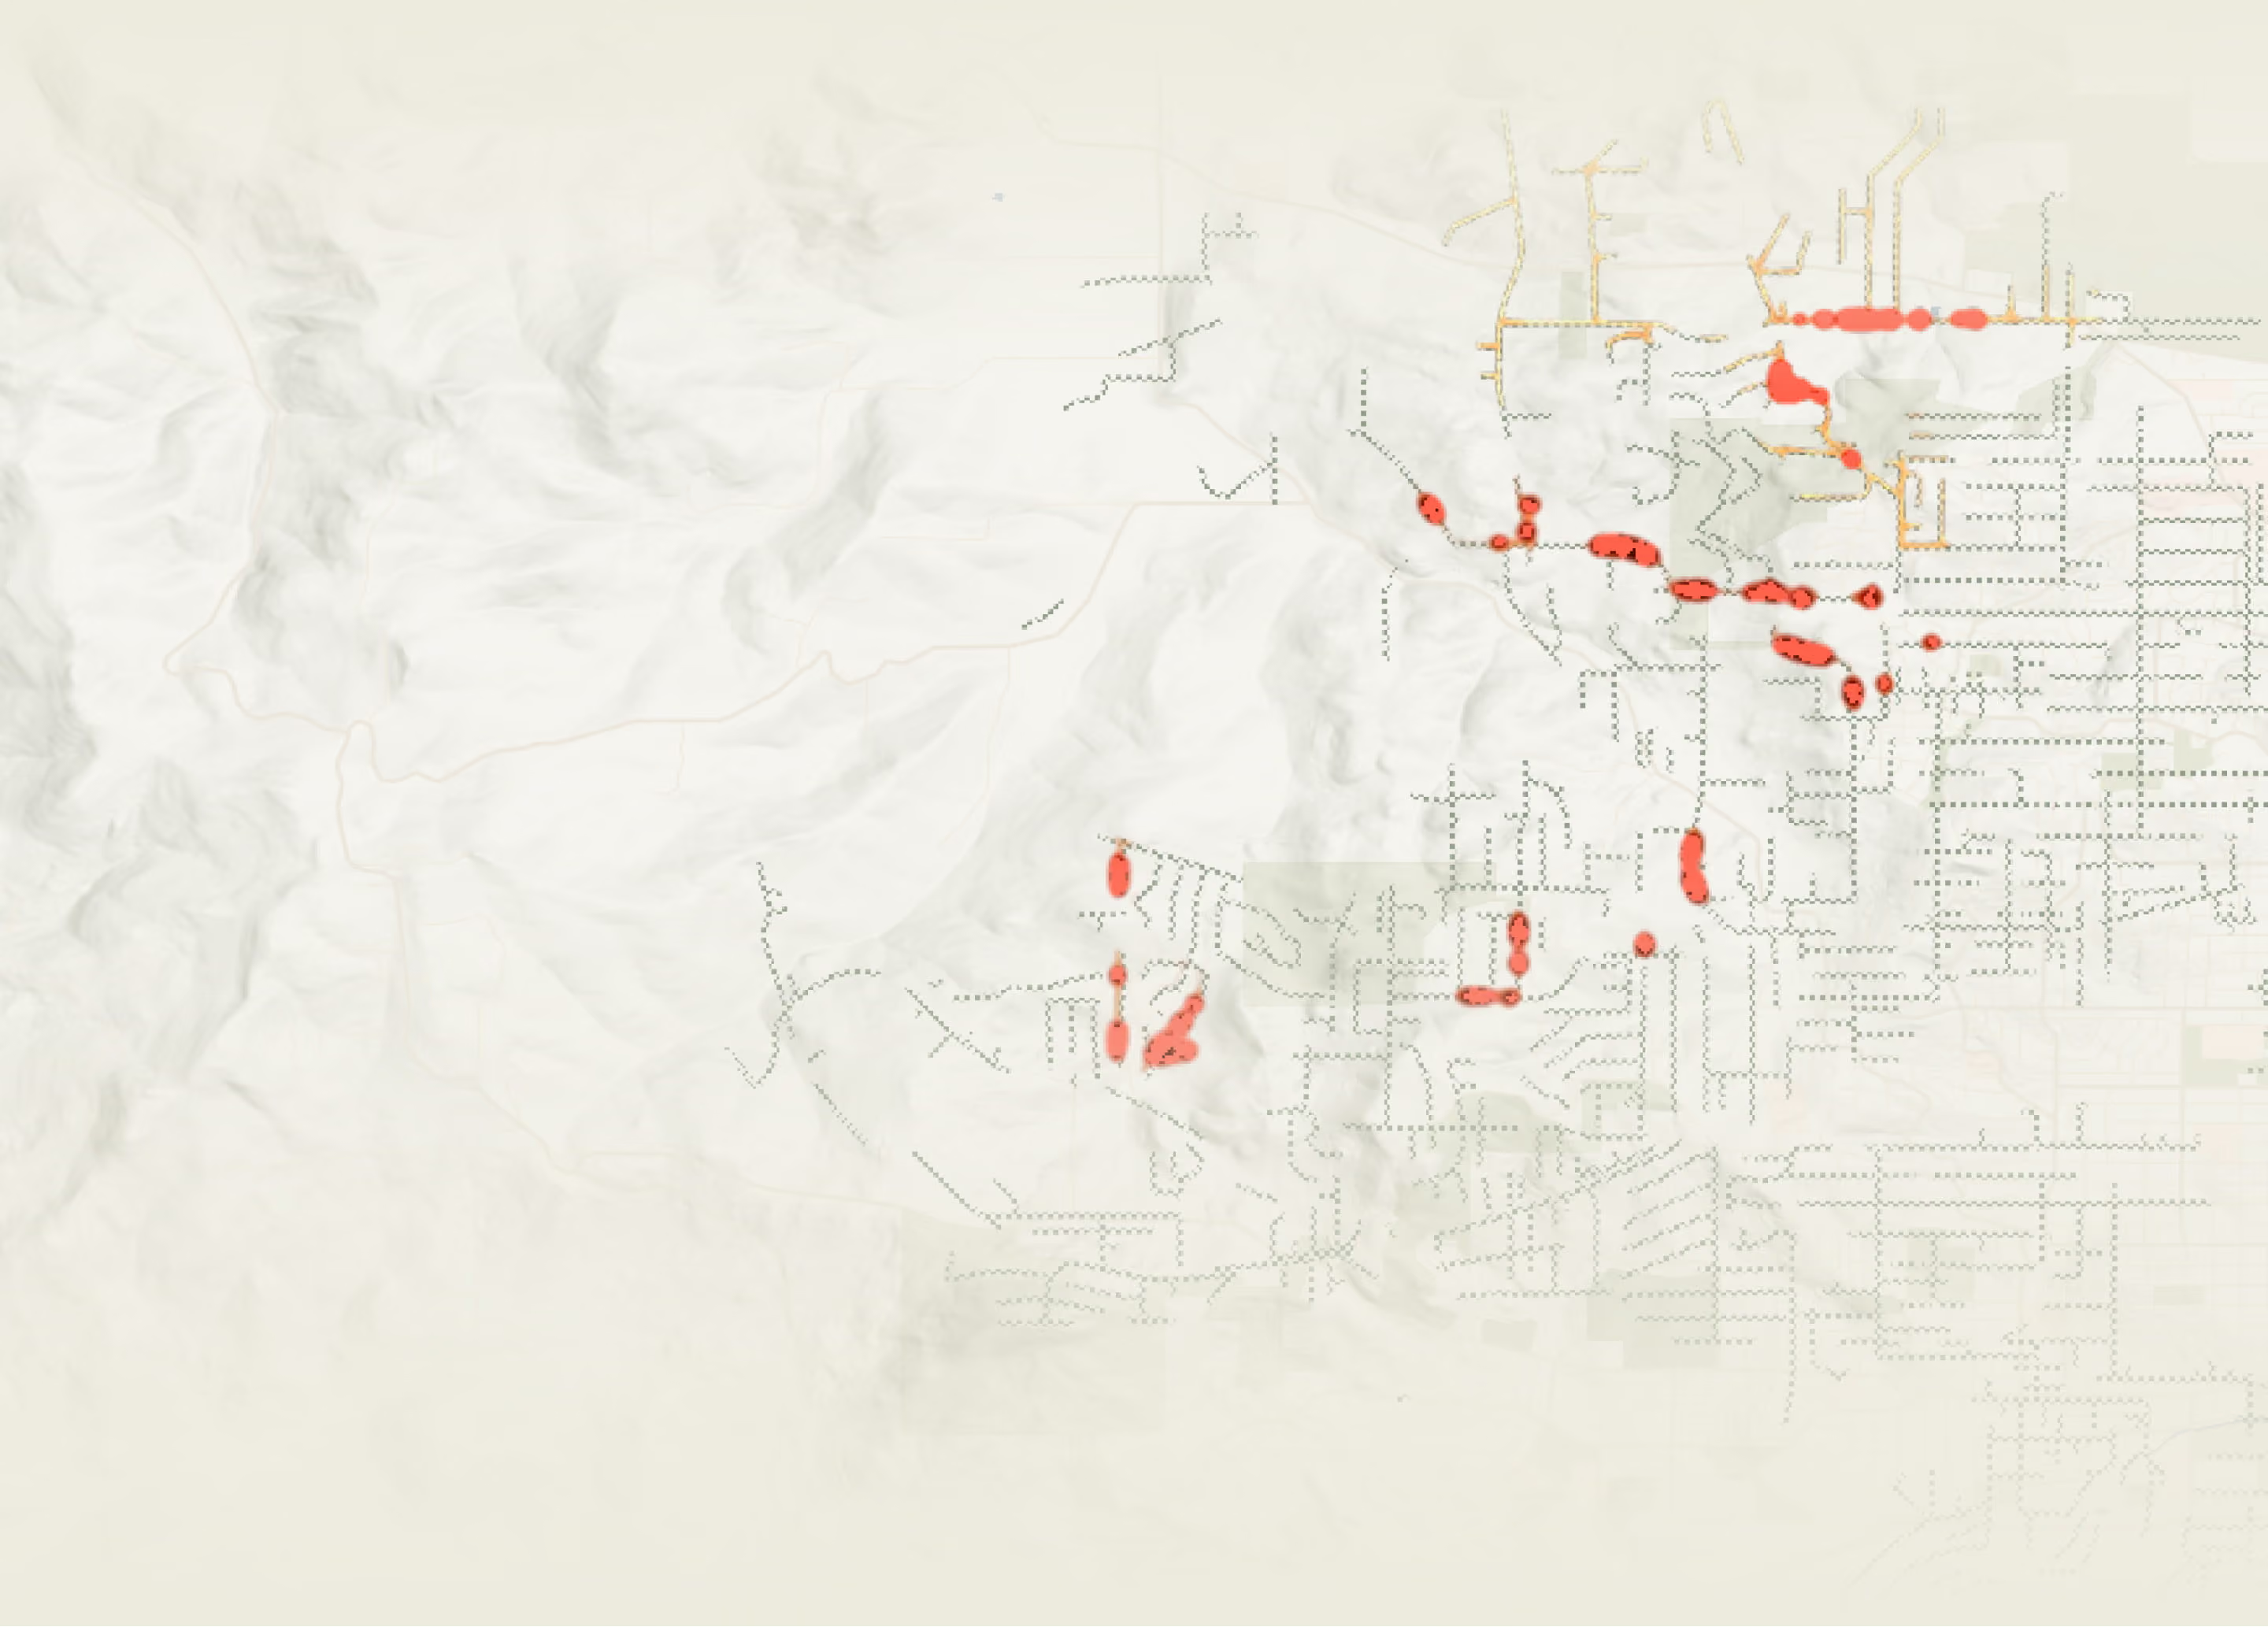
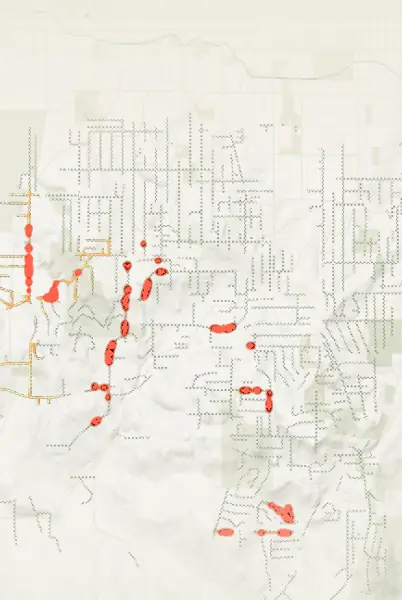
Map showing a network of streets overlaid with red highlighted sections indicating areas of activity or significance.Map showing a network of streets overlaid with red highlighted sections indicating areas of activity or significance.
Workload
40.5 mi
42% of network
Risk in scope
62
Outages
Eight rounded square text blocks with blurred gradient backgrounds, each describing a function: Height measures vegetation height using imagery and LiDAR; Terrain maps bare-ground elevation for height and clearance analysis; Segmentation detects individual tree crowns using arborist-labeled data; Health identifies signs of tree stress and decline; Outage estimates tree-related outage likelihood based on height, health, and past outages; Ignition estimates ignition likelihood from natural hazards and history; Fuel Detection maps high-resolution ground fuel types around utility corridors.
Blurred aerial view of a residential area with white lines radiating outward from a central icon representing a connected platform.Central icon resembling a connected dots network with multiple curved lines extending symmetrically from a circular center on a blurred natural background.
Get started

See your network clearly.
Act with confidence.